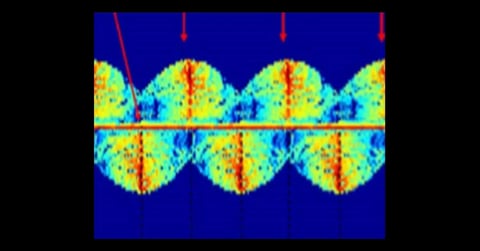
Lightning Strike on Wind Turbine
This example demonstrates one area of lighting strike analysis by showing the impact of fields created inside the nacelle of a simplified wind turbine generator for different strike locations. The example follows the work performed in the paper:
A. Amentani and K. Yamamoto, "A Study of Transient Magnetic Fields in a Wind Turbine Nacelle," 2010 Asia-Pacific International Symposium on Electromagnetic Compatibility, Beijing, China, April 2010.
In this case, the wind turbine is represented by a simple, perfectly-conducting tower mounted on a base embedded in lossy ground. The tower height is 60 meters and the turbine blades are each 40 meters in length. The nacelle is composed of a fiberglass material covering a metal wire frame. The wind turbine geometry is shown in Figure 1 where the vertical direction is Z and the long axis of the nacelle is Y. An FDTD grid space is created to hold the turbine in a cubical 0.5m grid that has total dimensions of 100 x 100 x 230m.
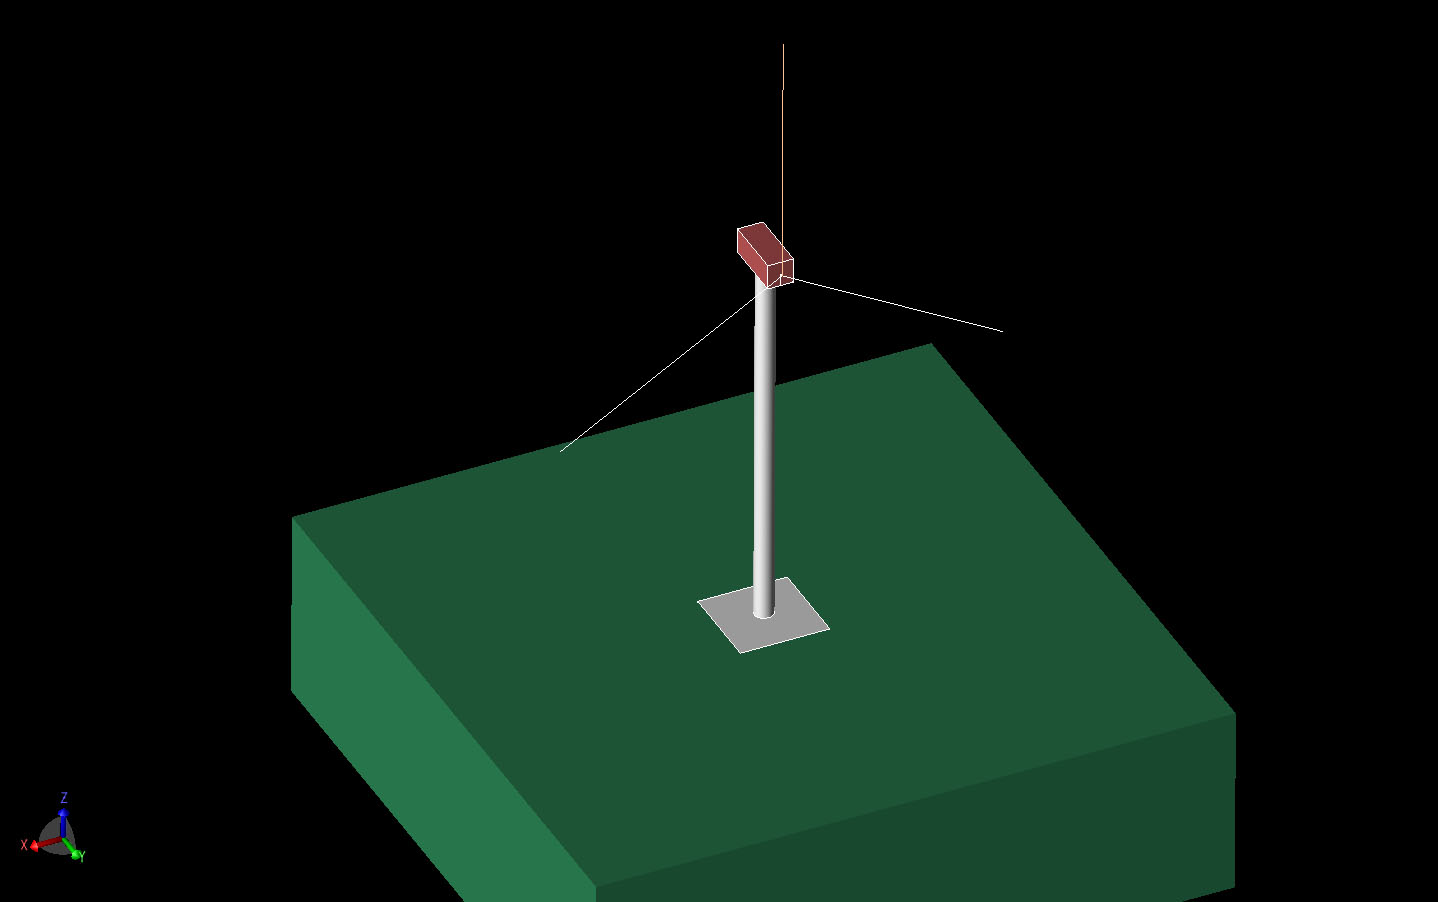
Figure 1: Three-dimensional CAD view of the wind turbine tower above a lossy ground. The tower is 60 meters high with each blade 40 meters long. The vertical axis is Z and the long axis of the nacelle is Y.
To represent the lightning strike, a step waveform with a rise time of 1 µsec is applied as a current source in parallel with a 500 ohm resistor. The waveform is created as a user-defined source and imported into XFdtd. The current source is connected to a long wire that extends to the outer boundary of the FDTD simulation space. The current source is attached to the wind turbine in two locations that represent the most common lightning strike locations: at the top of the propeller blade and at the rear of the nacelle. In Figure 2 the current source is highlighted in bright red at the rear of the nacelle with the long wire extending to the outer boundary above it. For this exercise, the source amplitude is adjusted to give a 1 A current flowing into the turbine.
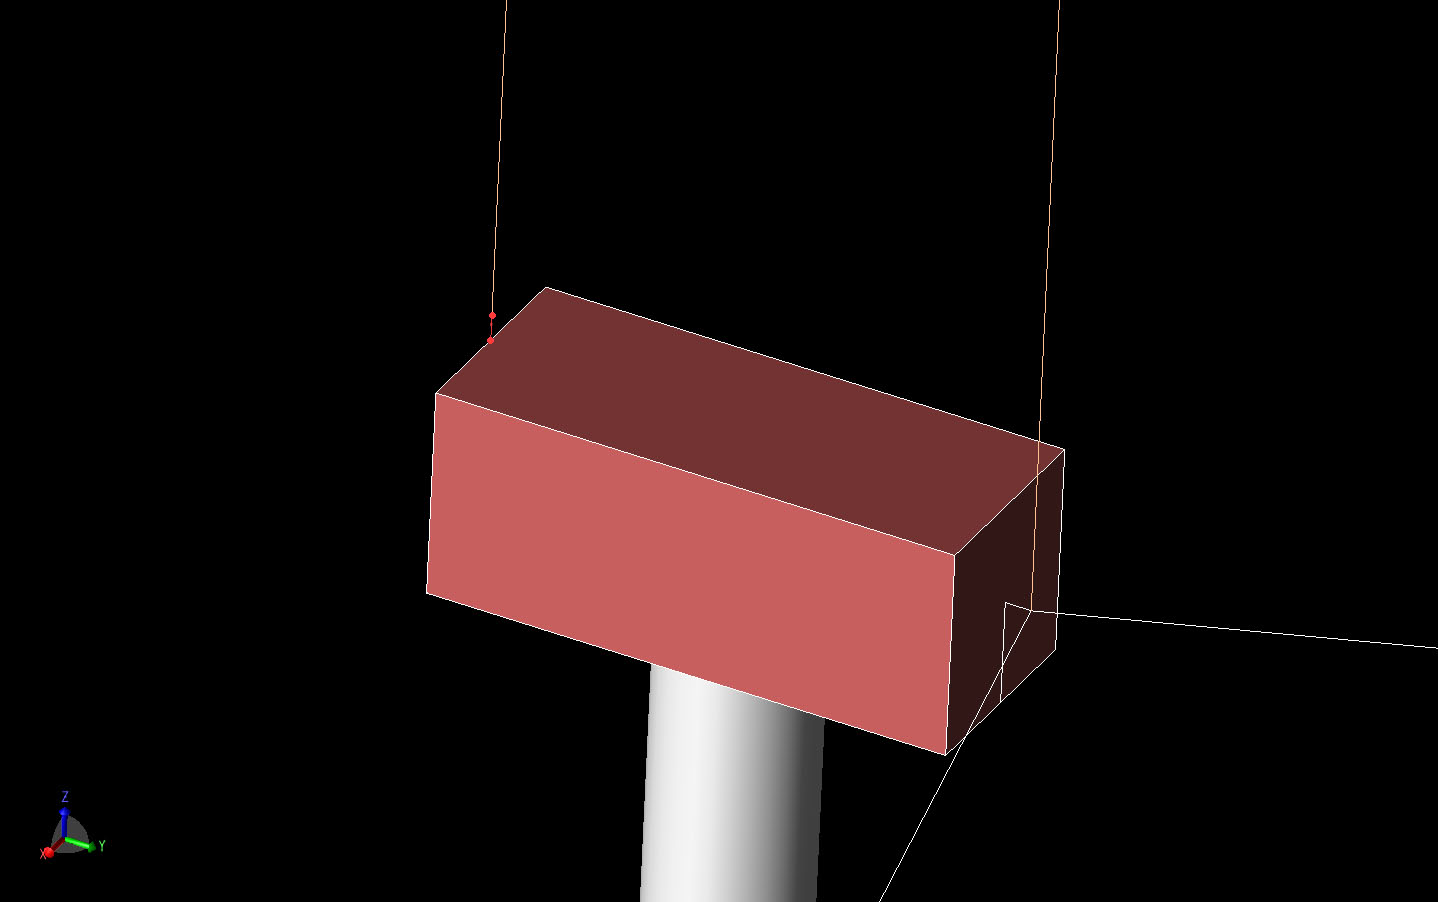
Figure 2: The current source location is shown in bright red for this case where the lightning strike is applied to the rear of the nacelle.
The impact of the lightning strike is gauged by monitoring the magnetic fields at several sample locations within the nacelle. Four sample points are shown in Figure 3 which are as follows: symmetrically around the connection point of the blades, near the center over the tower, and at the rear of the nacelle. Additionally, two planes of transient magnetic fields are saved at a few instances in time.
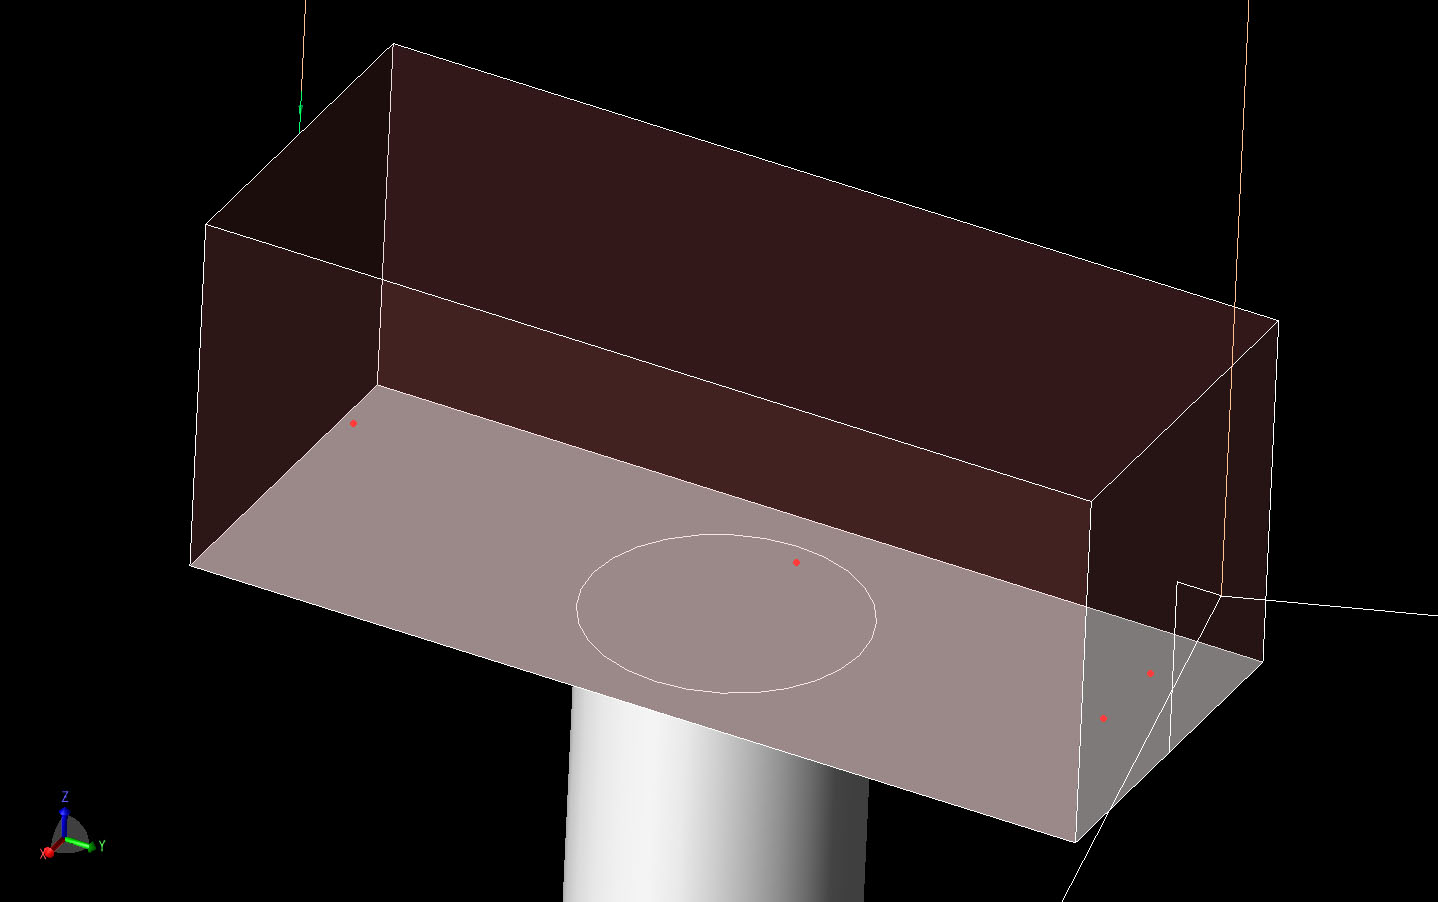
Figure 3: The interior sample points are shown in relation to the nacelle geometry. Three of the points are in a line from front to back inside the nacelle.
The simulations are performed for a total time of 3 µsec to show the initial rise of the waveform and the creation of the fields. Figure 4 shows the current flowing through the source and into the wind turbine. In Figure 5, the magnetic fields in the X, Y, and Z direction are plotted in the center of the nacelle for the case of a strike on the top blade. In Figure 6, the magnetic fields are plotted at the same point for a lightning strike on the rear of the nacelle. As can be seen, the values are significantly higher for the strike on the blade. The higher field strength for the blade strike is further demonstrated by comparing Figure 7 with Figure 8 where points 0.5 m away from the struck outer edges of the nacelle are compared. In Figure 7, a point near the blades is plotted for a blade strike and shows field levels that peak around 0.18 A/m. Figure 8 shows the magnetic field at a point near the rear of the nacelle during a strike at the rear and the peak levels are around 0.035 A/m. Figures 9 and 10 show the cross-sectional view of the transient magnetic fields at the same instant in time for each strike point. In Figure 9, the fields surrounding the current path from the blade through the nacelle case to the tower are stronger inside the nacelle than those from the rear strike shown in Figure 10. As such, the conclusion reached by the authors of the original paper was to increase the shielding surrounding the front of the nacelle to reduce the induced fields. As a test, a PEC sheet is placed over the end of the nacelle nearest the blades and the simulation is re-run. In Figure 11, it can be seen that the field strength, plotted as magnitude rather than individual components, is reduced by adding the shield.
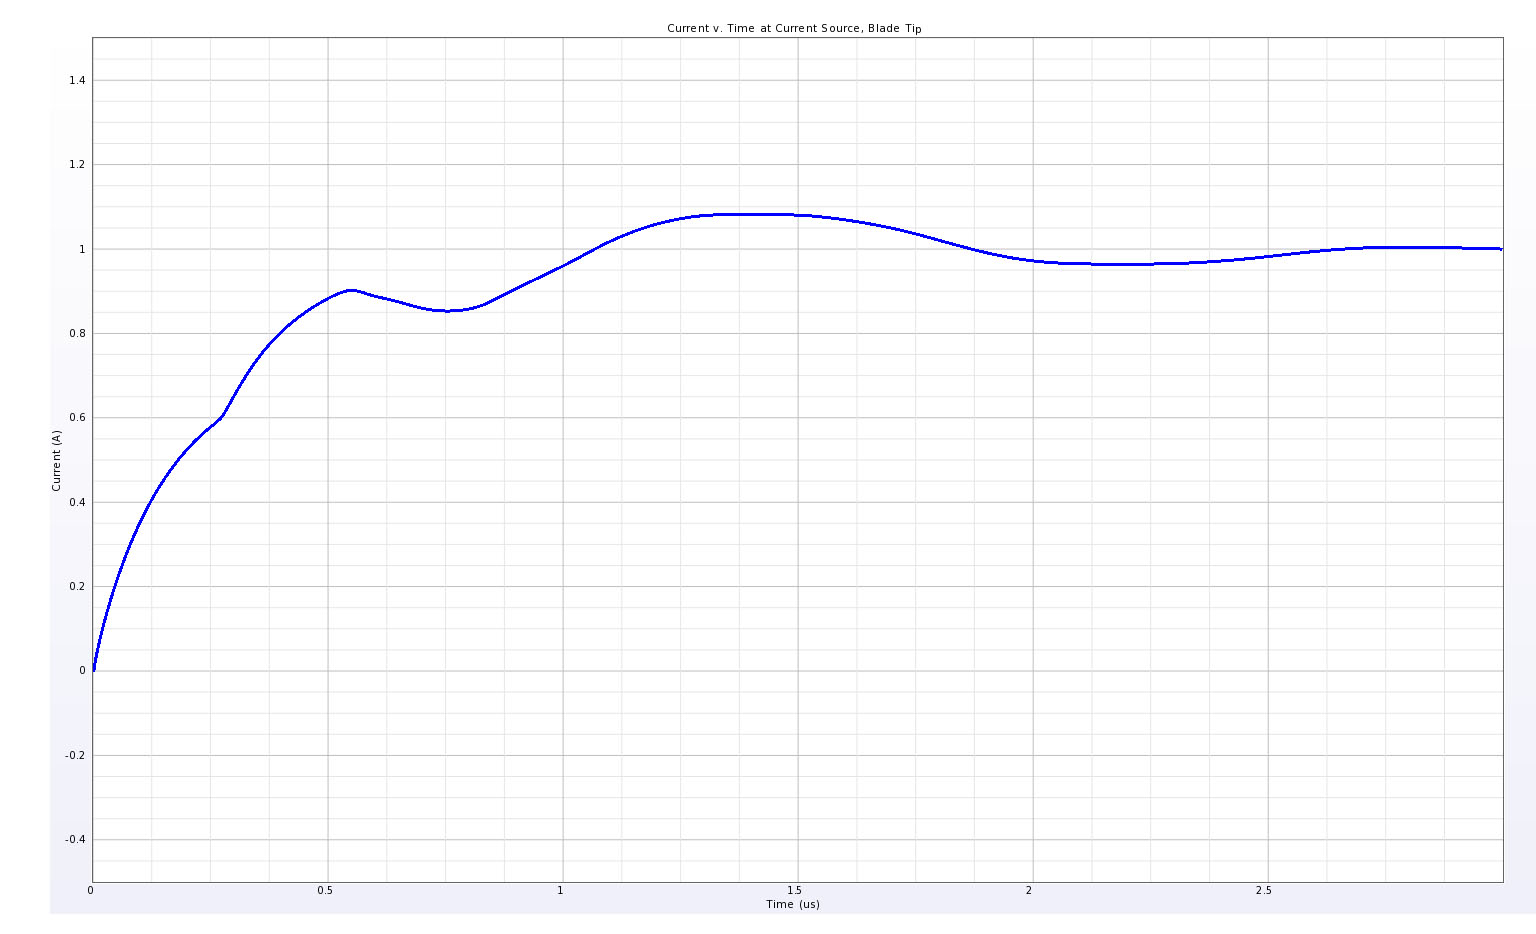
Figure 4: The waveform of the input current applied as the lightning strike source is plotted.
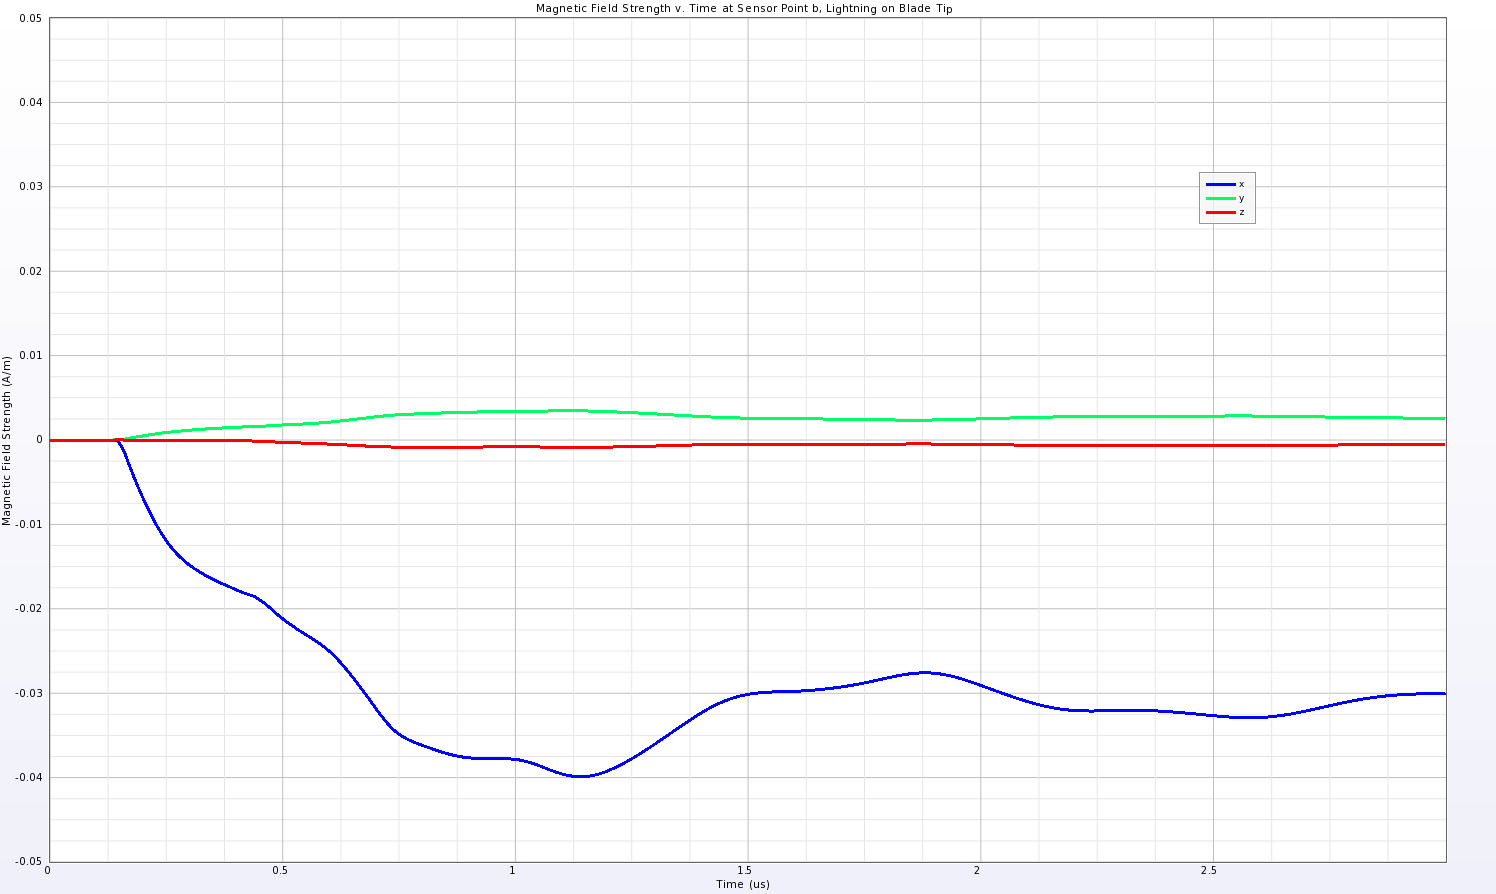
Figure 5: Shown are the magnetic fields in the X, Y, and Z direction inside the nacelle at the center sample point located over the tower for a blade tip strike point. These fields show higher amplitudes than those produced by a rear strike.
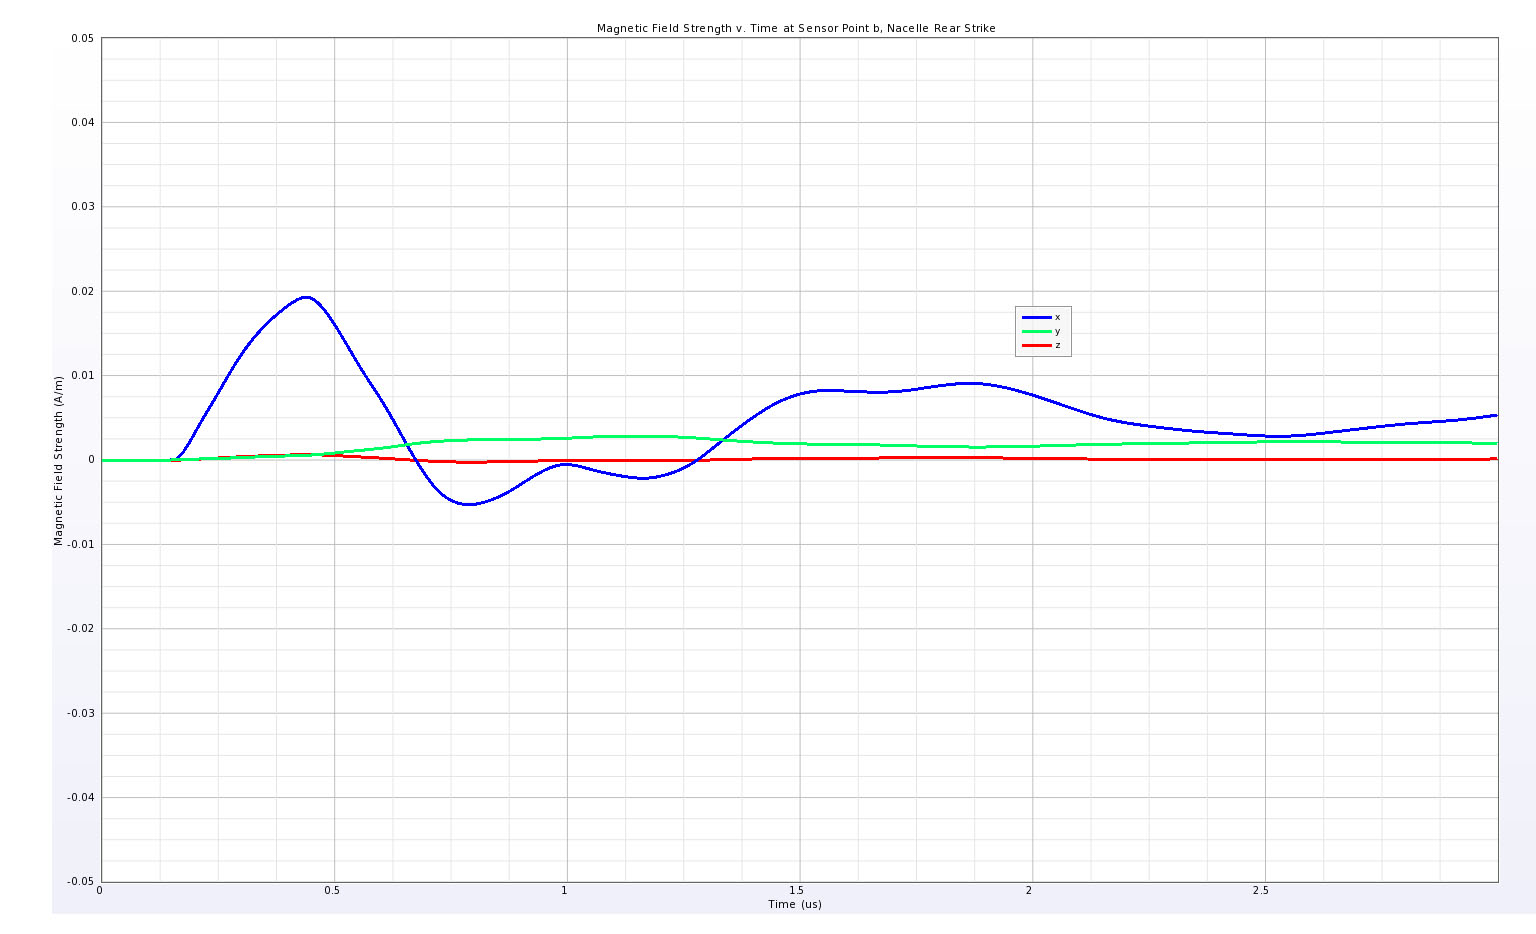
Figure 6: Shown are the magnetic fields in the X, Y, and Z directions inside the nacelle at the center sample point located over the tower for a rear of the nacelle strike point. These fields show lower amplitudes than those produced by a rear strike.
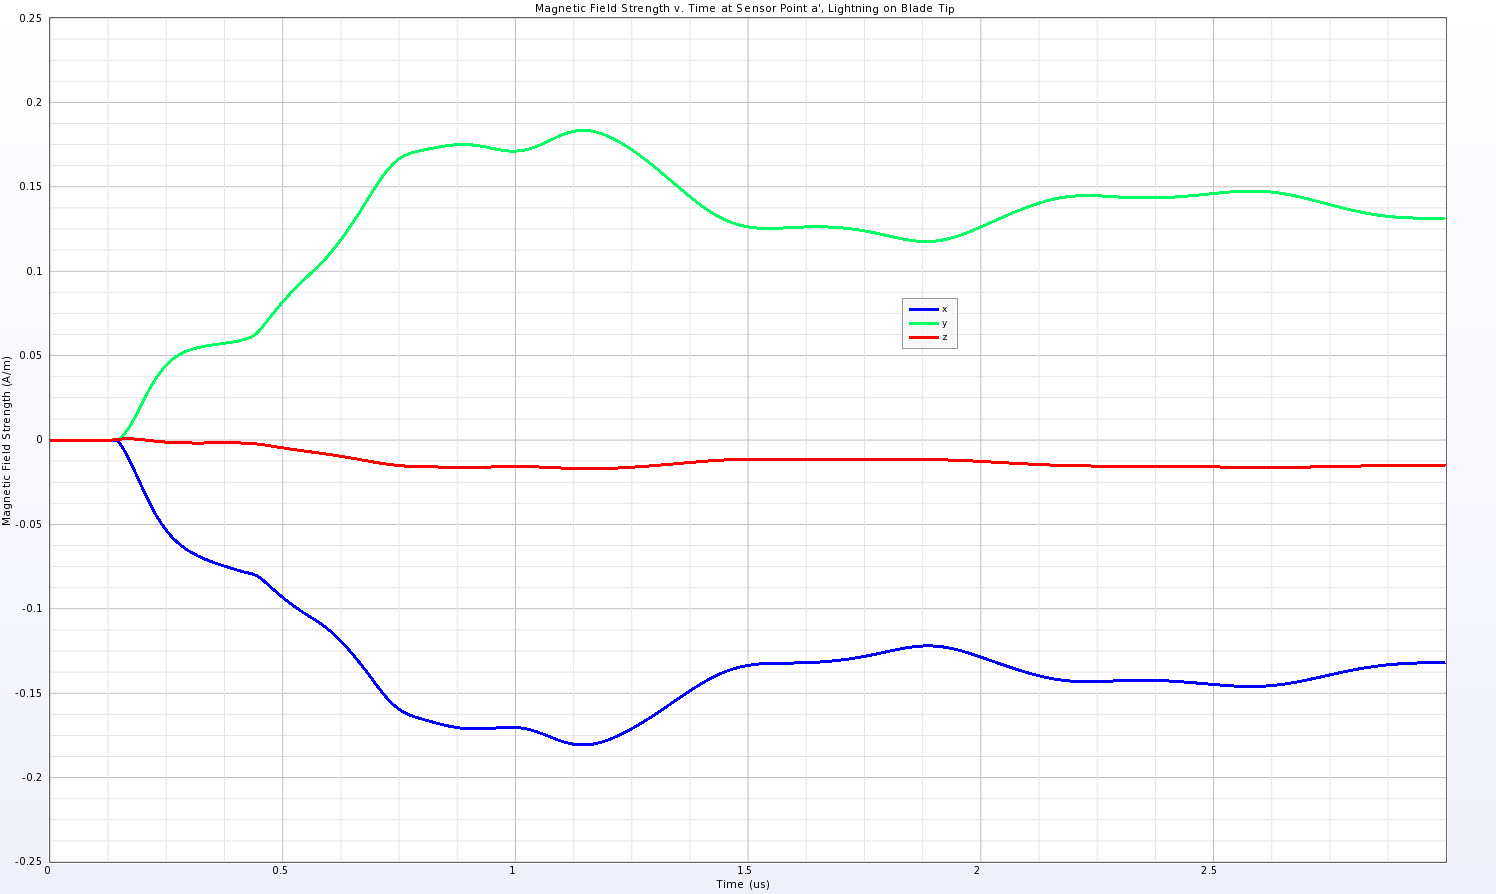
Figure 7: The magnetic fields located 0.5 m inside the front of the nacelle are shown for a strike on the blade tip.
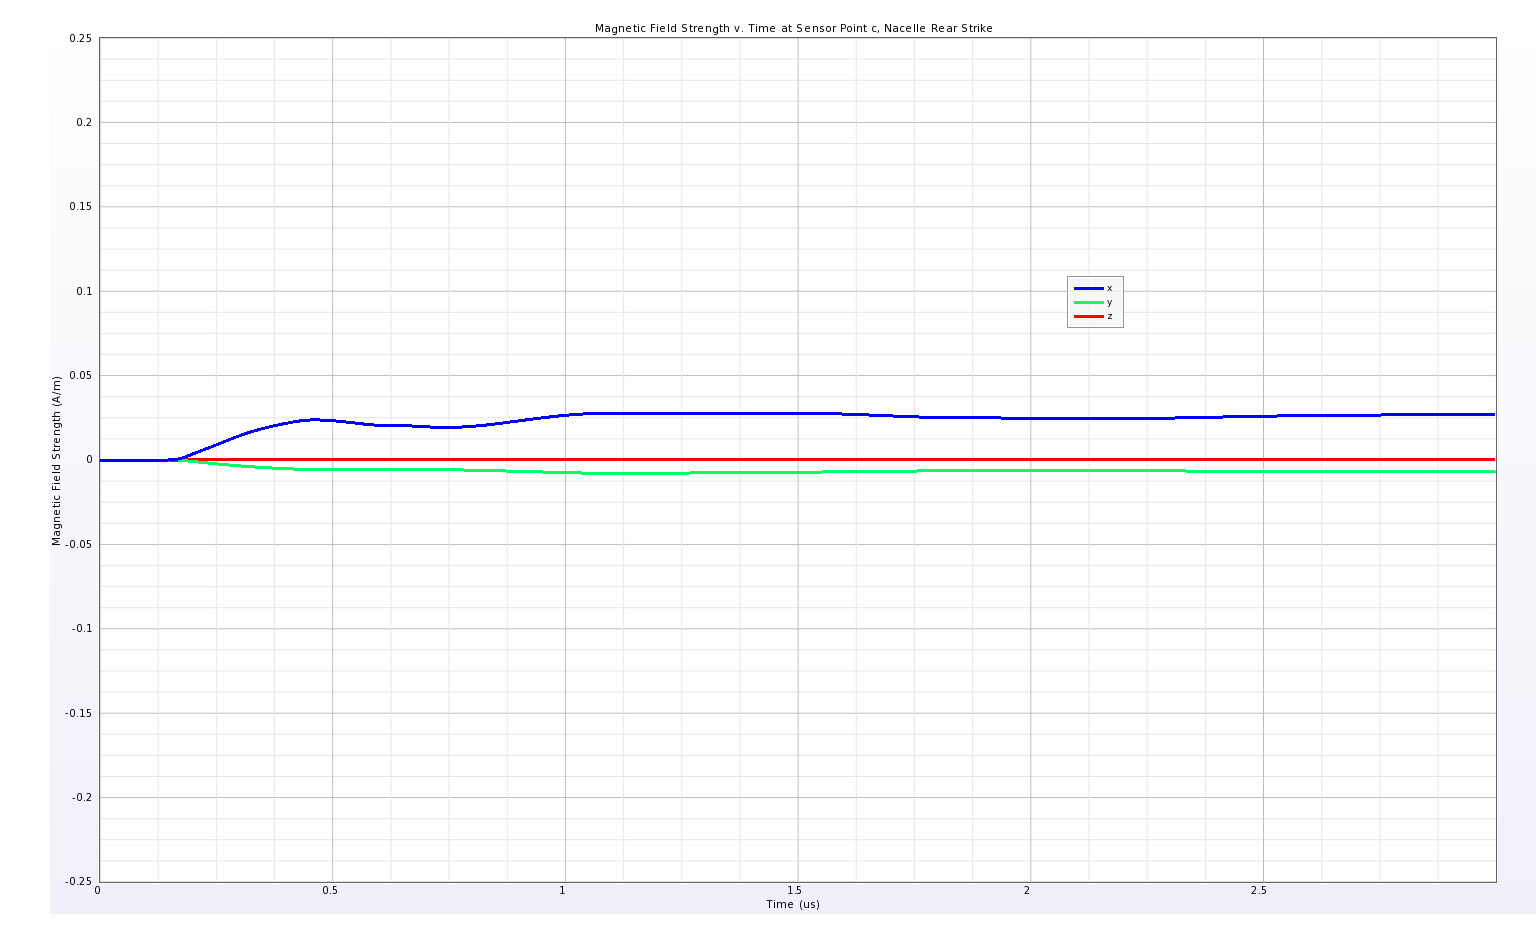
Figure 8: The magnetic fields located 0.5 m inside the rear of the nacelle are shown for a strike on the nacelle rear.
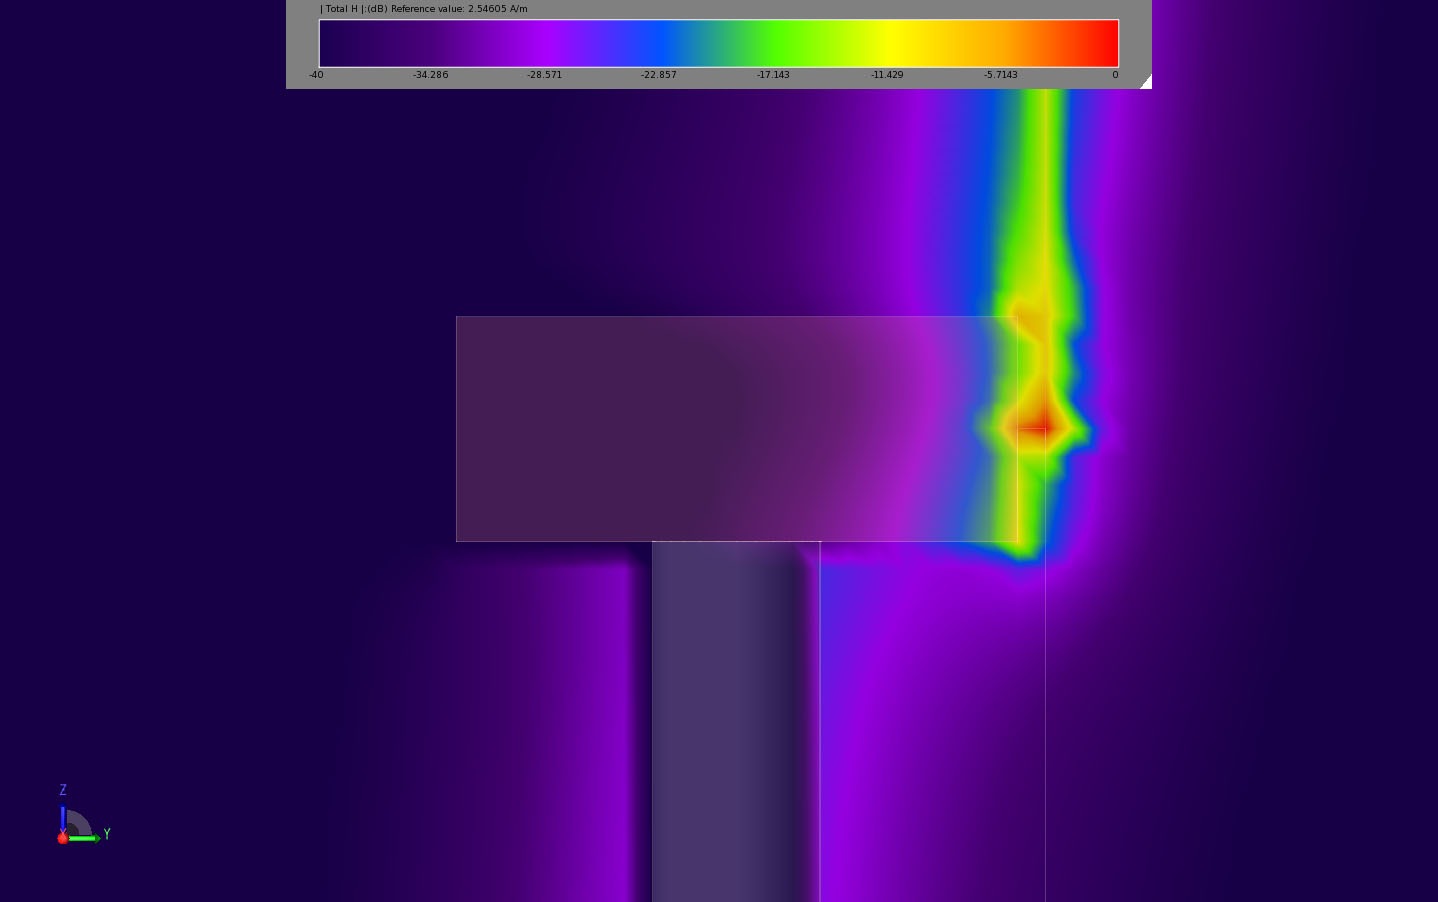
Figure 9: The planar time-domain magnetic fields are shown in the cross section of the nacelle for a strike on the blade tip.
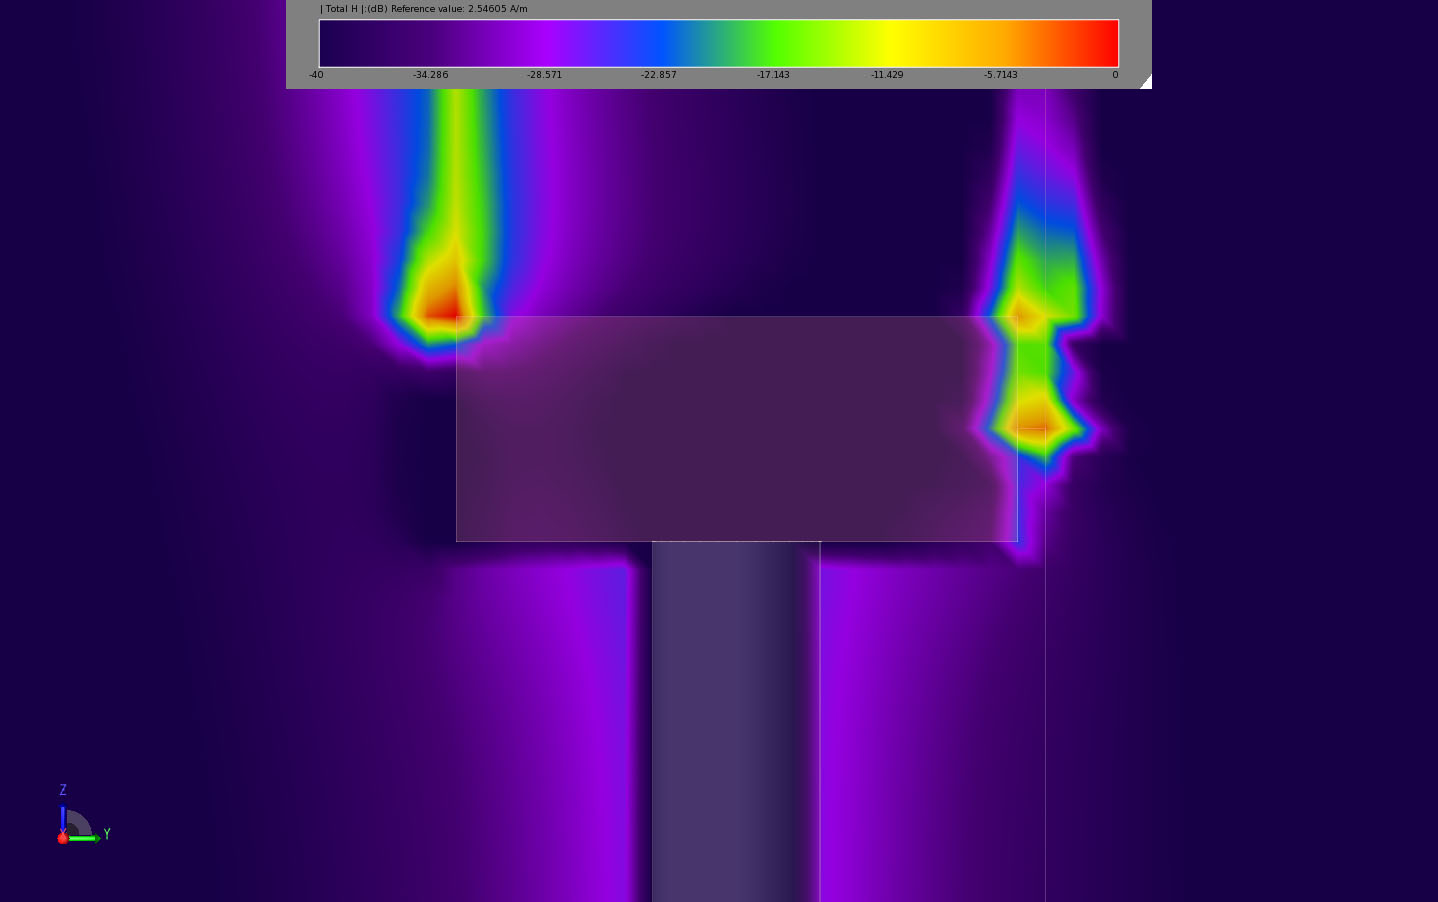
Figure 10: The planar time-domain magnetic fields are shown in the cross section of the nacelle for a strike on the rear of the nacelle.
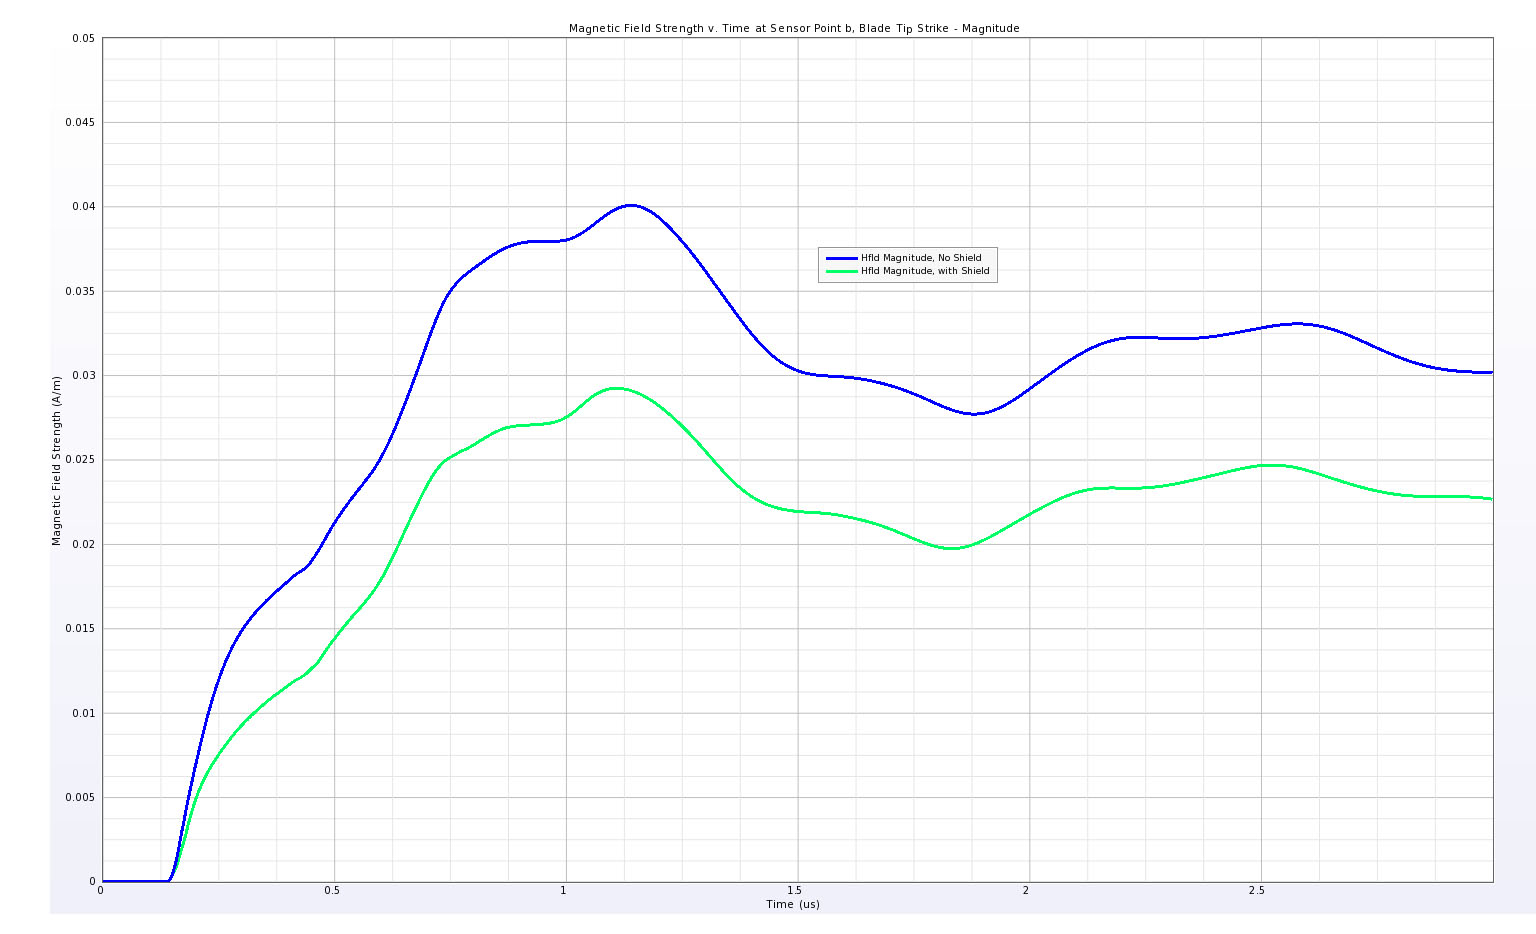
Figure 11: Shown is a comparison of the magnetic field strength (magnitude) at sensor point b in the center of the nacelle for the original case of the blade tip strike and for the shielded case where a PEC plate is added over the nacelle end nearest the blades. The shield reduces the magnetic fields inside the nacelle as expected, but additional shielding on the sides of the nacelle will likely be necessary to significantly reduce the interior fields.
Request Project Files
Thank you for your interest in this application example. Please complete the form below to download the Lightning Strike on Wind Turbine project files.
