- Products & Solutions
- XFdtd
- Dynamic Interactive Graphs
Dynamic Interactive Graphs
Working with results is simple in XF.

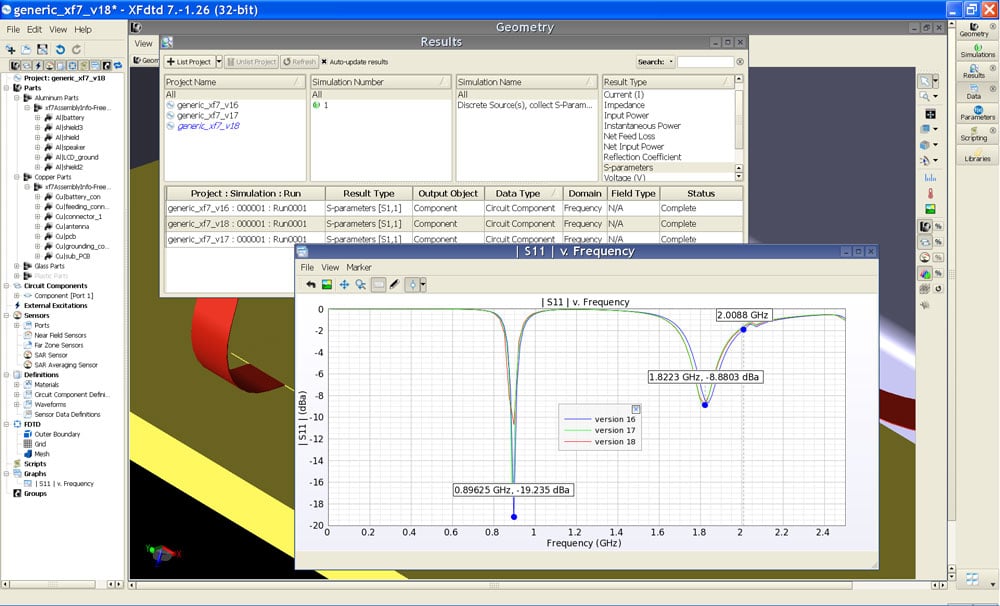
Why wait until your simulation is complete to inspect the results? With XF, you can view your results as they are computed, and they'll automatically update as new data becomes available. You can also navigate graphs more naturally using the mouse-based graph navigation tools. The graphing engine in XF allows you to view your results faster and more interactively than ever before.
Key Features
- Smooth mouse-based graph navigation
- Automatic updating during simulations
- Heads-up properties display for customizing graph appearance
- Horizontal, vertical, crosshair, and point markers
- Data and image exporting


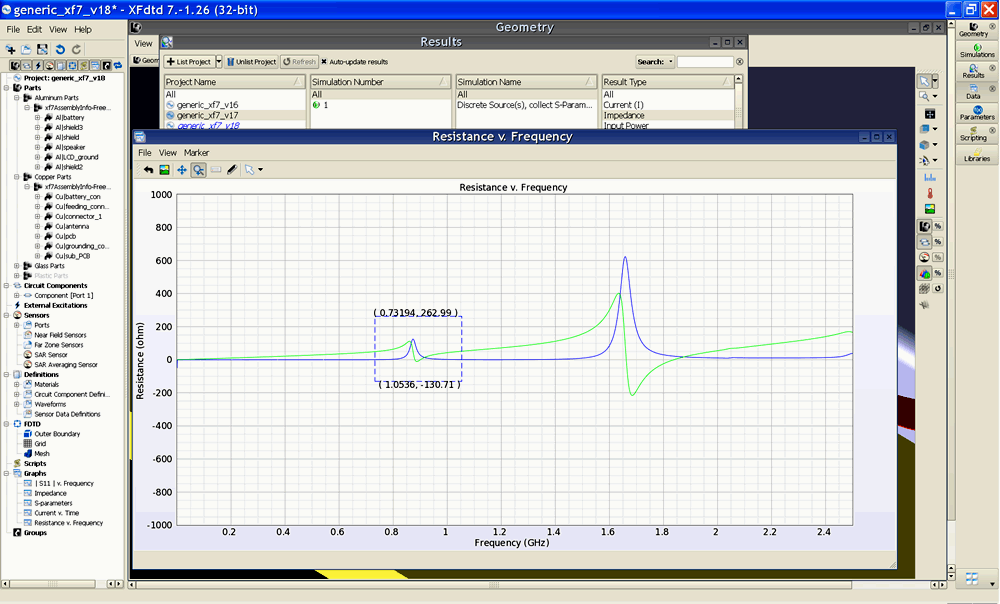
The mouse-based pan and zoom controls are a faster and more intuitive way of navigating through the data in your graphs. Scroll to zoom in and out, on both axes or an individual one. Even with graphs containing huge amounts of data, XF makes working with graphs smooth and efficient.
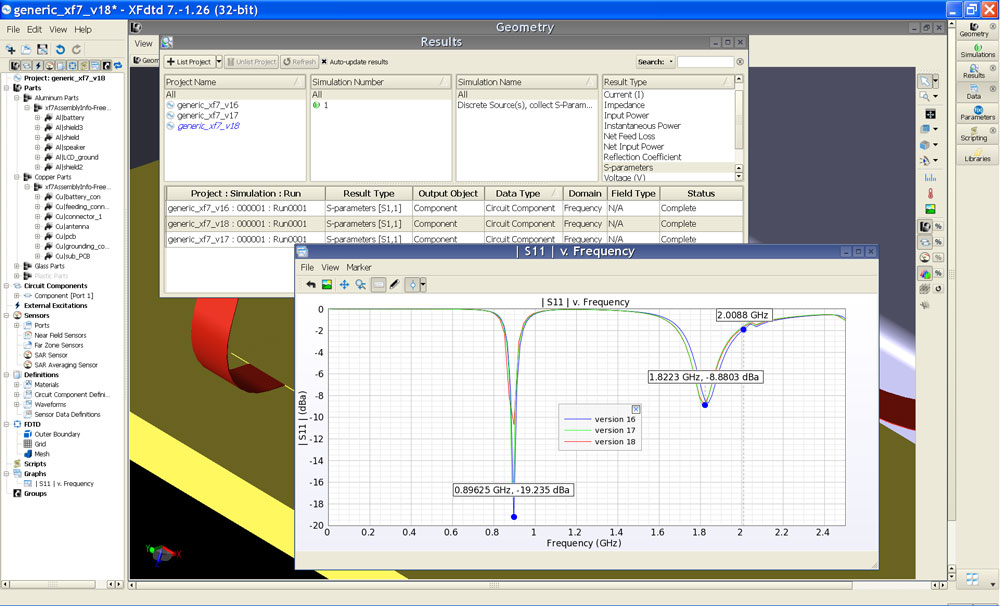
Important parts of the graph can also be tagged with markers. Vertical, horizontal, or crosshair markers can be added, scrolled, attached to plots, or used to mark any position on the graph.
Save time and reduce costs.
Contact Remcom today for a customized solution to your most complex electromagnetic challenges.
Request a Quote